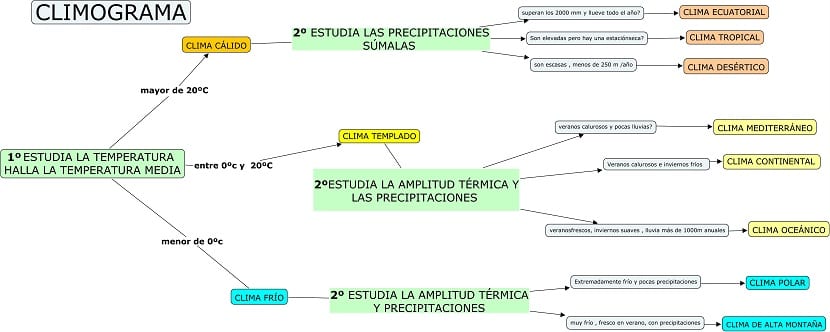
For those who have studied bachelor of science or a career or degree in environmental science or similar, the word climagram it is sure to be more than known to them. If you are one of those who do not know this term and want to know how it is done, then we tell you both the definition and way of making it.
Definition of climagram
According to the SAR, "Climogram" refers to the graph which represents the average values of rainfall and temperature of an area in a given period.
La rainfall It is the amount of precipitation (rains) that has occurred in a certain place, for those who do not know the data either.
How to make a climate chart

Once we know what the word climogram refers to, we will explain how to make a climogram. It is very simple!
We will represent it by 3 axes: a horizontal and the others two placed vertically, forming a kind of box or cubicle (figure). One of the vertical axes, the one furthest to the left, will represent the number of rains (rainfall, rainfall); the other vertical axis, that is to say, the one furthest to the right, will represent the temperatures; and finally, the only existing horizontal axis will make up the months (so it must be divided into 12 equal parts).
Once we have made the figure, we will read the data we have on the rainfall and temperatures of a certain place, representing each data in the following way:
- All the Rain will be represented by bars.
- All the temperatures will go in points, which will be joined one after another, until giving a line.
In this way, and by taking a look at this data, we will have all the information referring to the rainfall and degrees of the geographical area that we have analyzed. Depending on the season in which we are, we will see just by reading and interpreting this graph, if there has been a dry or rainy season, if we are facing a tropical or arid climate, etc.
We hope that with this brief but complete information you can make your own climate chart according to the rainfall and temperature data of your city. We encourage you to give it a try.