
You know what is a diagram? When we are doing a study or a presentation and we want certain information to be well ordered and classified, one of the things we can do is a diagram; that is, a graph that serves to improve communication and information about a process or system.
It is very interesting to choose to do one, since There are so many types that we can make one that best suits to our needs, but before we start, let's see what a diagram is.
What is a diagram?
A diagram is a schema that represents the relationship between several words that are clues in the text or short sentences.
In a diagram, ideas are presented in an orderly and systematic way allowing to show the relationships between them. The objective is to induce to build mental structures by identifying main ideas and subordinate ideas according to the logical order.
Organize the information in a diagram facilitates the perception and memory of relationships between ideas, it's very convenient for quick reviews.
How do you make a diagram?
Building a diagram is an iterative process, in which each step that a concept is chosen to expand other concepts are determined subordinate to it, these concepts are represented through keywords or short phrases, and thus the concepts to be expanded are related.
The steps to follow to make a diagram are the following:
- Find out what is the input element of your system, that is, the concept that should encompass everything.
- Decide the type of diagram you need, as well as the direction you want it to take (from left to right, top to bottom, with the main idea in the center and the graphics around it,…).
- Choose the language you are going to use. Remember that the shorter and more direct it is, the better. In addition, you must collect the meaning of the element to relate.
- Decide which icons and colors will represent each of the ideas or concepts. So you can easily differentiate them.
- Divide the diagram into blocks. This will help you to be clear about what you want to tell in each one, which will prevent you from forgetting something.
- Assemble it.
- Lastly, read it several times. Even if you understand it, ask a partner to read it. Everyone must understand the information you want to convey. If you have achieved this goal, then you already know how to make a diagram.
Types of diagram
Now that you know what a diagram is and how to do it, let's take a look at the different types of diagrams that exist. The most significant are:
Tree diagram
It is structured in a hierarchical way. The root of the diagram generally corresponds to the title of the diagram and each level down indicates more detailed information on the subject being learned.
Circular diagram
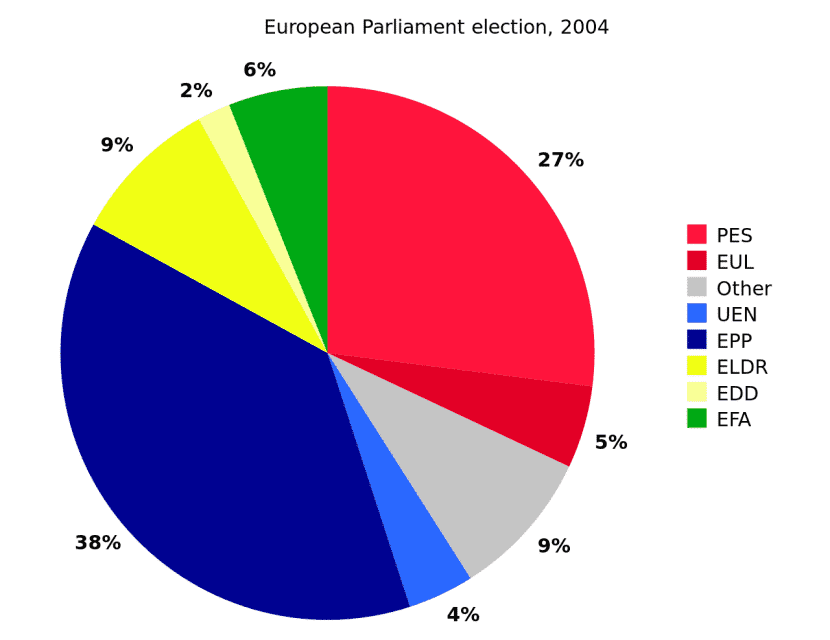
Known as a pie diagram or pie chart, it is used to represent frequencies expressed through proportional portions.
Concept diagram
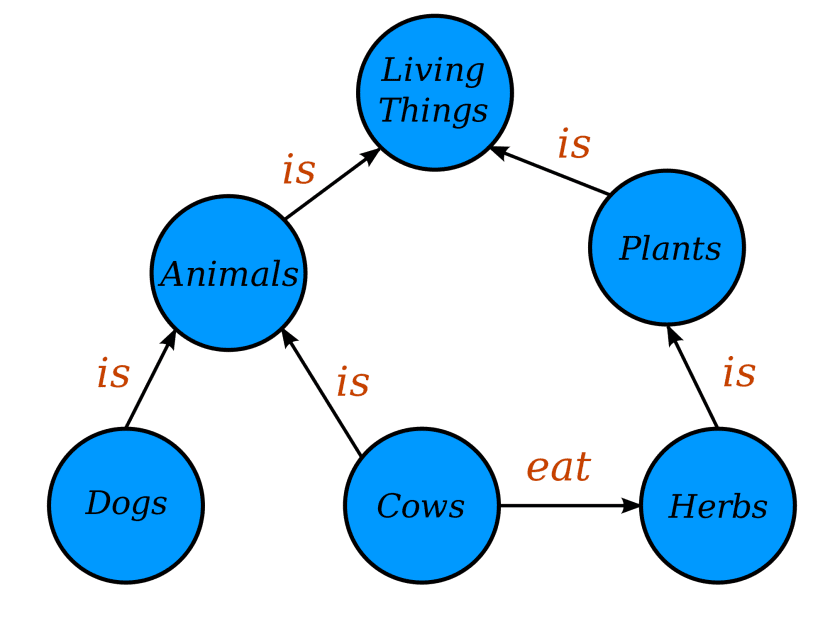
It can be simple or complex, depending on the amount of concepts and ideas that you want to add and relate. It is widely used by those who take advanced subjects, as it helps them to simplify the study.
Bar chart
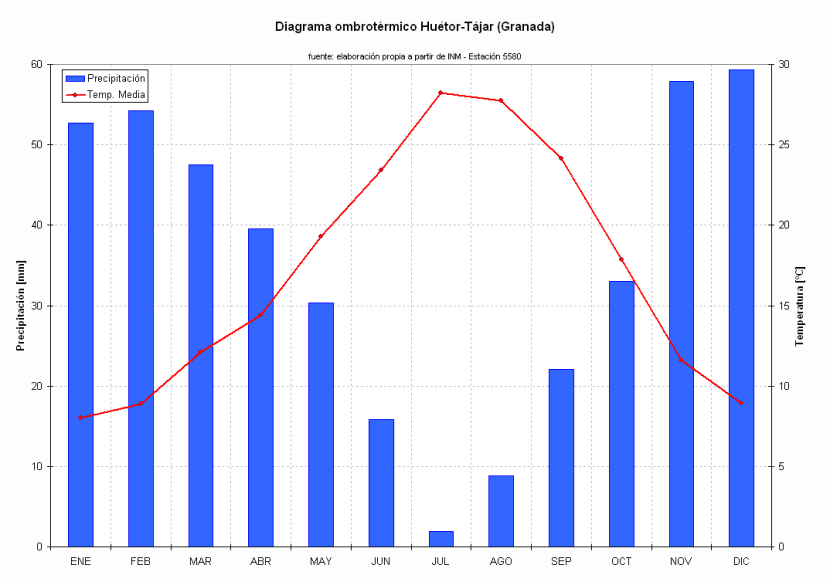
On its horizontal axis they represent modalities or data, while on the vertical axis the frequencies of each one of them.
Floral diagram
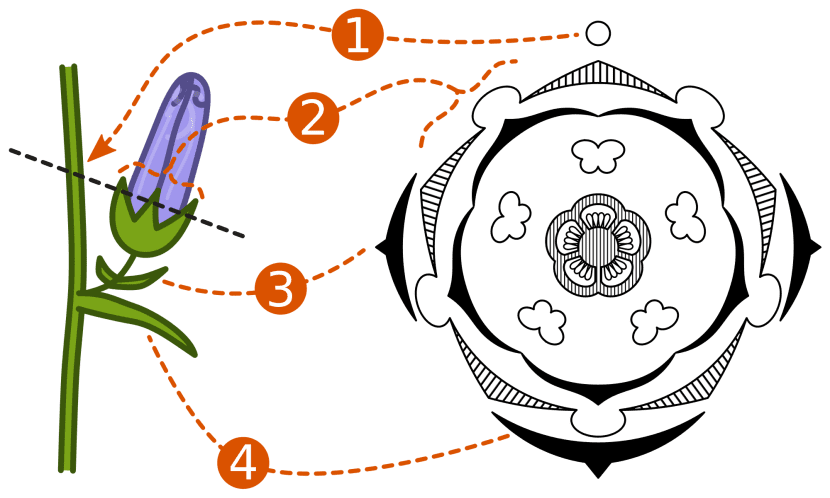
It is used to graph the floral species. With this type of diagram, you can obtain information about the components of flowers, from the smallest parts to the largest, which can be used to make a complete study of each of the parts that form them.
Flowchart

It is characterized by having an oval as a starting and closing point, a rectangle where an action is detailed, a rhombus to graph the execution of a decision, a circle as a component that connects everything and the triangles that are used to explain the documents that are necessary.

Process diagram
It is used to graphically represent the different steps of a specific process. The steps are differentiated by symbols, and in addition, data is included that will allow a more complete analysis of the process.
Radial diagram
In this type of diagram the main title is placed in the center and the phrases or keywords are immediately related to the title and linked through arcs. This type of diagram differs from the tree diagram in that it develops the structure in all directions, fanning it out.
Synoptic diagram
From an idea or concept, an extensive network of interrelated knowledge spreads. It often features braces and brackets that open or close ideas.
Organizational chart
They are those that are used to represent the organization of a certain company. Each graph shows the different areas that make up the entity as well as the name of the person who runs it.
The construction of diagrams should be part of the study habits because a complete hierarchy of knowledge is elaborated. So we hope you now know what is a diagram and how can you make one 🙂.
WHAT WE DON'T GIVE IS VERY INTEREST BECAUSE WE LEARN MORE THAT IS VERY GOOD FOR OUR TASK
popopopopopopopopopopopopopopopopopopoopoo
helooooooo meyamo pancrasia I'm dibina, horny
so bad huh bad
you're a bitch
this is a porkeria
k bn but almost nobody visits this page k wrong… poporprporprorrpprorpppporrrrooooo ??? Greetings to all and to all the vgbnds k pasn pore akiii… ..hehehejjejejjajajajjaja
haajaajaja loquendo !! xDDD
xDDDDDDDDDDDDDDDDDDDD
Who tells me 5 examples of a radial